
Fall TV Success Hinges on Audiences as Much as Viewers
Just as we did in our last blog post, we take a look at another sign that fall is here: the start of the new television season. Although we are in a time when cable networks’ year-round schedules and shortened seasons have prompted broadcast networks to follow suit, this event still holds particular significance because of its tradition, and more importantly, the financial health of the “Big Five.” In a marketplace with heightened competition for eyeballs, it has become increasingly necessary for a program to establish itself as its own brand, reaching the consumer wherever she is.
Success in this area is based in part on how strongly engaged audiences are on social media, and how the engagement translates back into ratings, which ultimately keeps shows on the air? While this is a very complex question with many factors, it’s reasonably safe to say that social engagement may translate to ratings, and vice versa. This post will not try to quantify how much social engagement it takes to shift ratings, nor will it try to prescribe a formula for shows’ success online. Too many extraneous factors – production costs, networks’ ownership of programs, prior relationships with studios/actors/creators, just to name a few – enter the equation. We will simply look at how often, and when, ratings success matches social success.
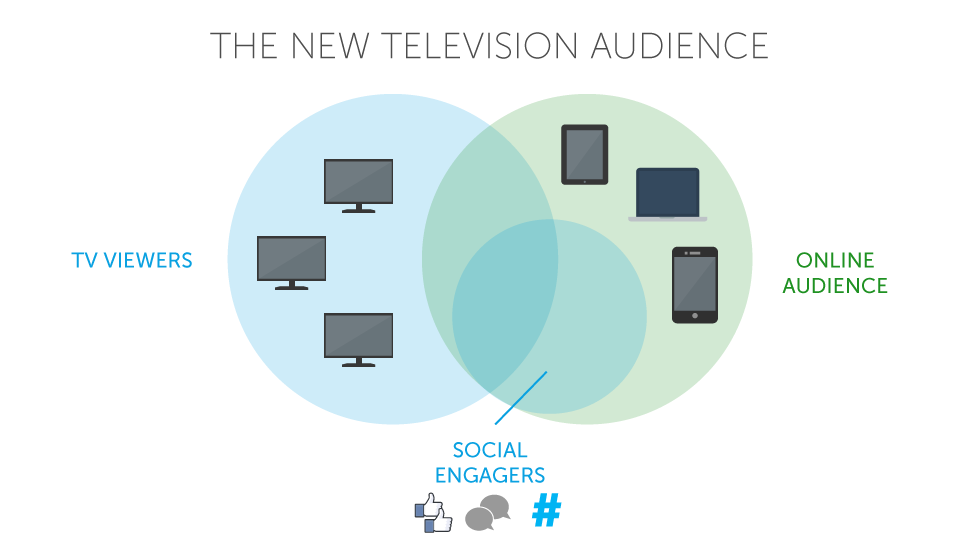
Before we look at the specifics of viewership vs. affinity, let’s discuss a concept we first introduced last week. Affinity Answers believes that a television show’s fan base is comprised of two somewhat distinct groups: the viewer who tunes in every week, and the online audience which has high mutual affinity to the show across the web. Within this online audience are social fans and engagers with the show. This subset of the online audience is comprised of users who will respond to the memorable social content and experiences, and will hopefully also become viewers.
For example, take a look at the scripted shows premiering in fall 2013. We examined the number of total fans and each show’s percentage of fans who are engaged for three points in time: just before the start of the fall season (through September 4, 2013), four weeks prior to that, and during the previous season’s finale week. Also, on the other side of the equation is the ratings rank* for A18-49 at the end of the season. Finally, we have the fate of the program – was it renewed or cancelled?
| Year | Network | Show | Fate | Season Increase – Total Fans | A18-49 Ratings Rank |
| 2013-2014 | CW | Reign | Renewed | 3,924% | 149 |
| 2013-2014 | ABC | Trophy Wife | Cancelled | 2,848% | 101 |
| 2013-2014 | CW | The Tomorrow People | Cancelled | 2,617% | 148 |
| 2013-2014 | CBS | The Millers | Renewed | 2,195% | 23 |
| 2013-2014 | ABC | Back in the Game | Cancelled | 1,803% | 63 |
| 2013-2014 | NBC | The Blacklist | Renewed | 1,684% | 7 |
| 2013-2014 | FOX | Sleepy Hollow | Renewed | 1,173% | 15 |
| 2013-2014 | CW | The Originals | Renewed | 986% | 112 |
| 2013-2014 | ABC | The Goldbergs | Renewed | 913% | 51 |
| 2013-2014 | FOX | Brooklyn Nine-Nine | Renewed | 748% | 56 |
| 2013-2014 | ABC | Betrayal | Cancelled | 720% | 106 |
| 2013-2014 | CBS | Hostages | Cancelled | 600% | 69 |
| 2013-2014 | CBS | Mom | Renewed | 429% | 40 |
| 2013-2014 | ABC | Marvel’s Agents of S.H.I.E.L.D. | Renewed | 389% | 20 |
| 2013-2014 | ABC | Super Fun Night | Cancelled | 354% | 47 |
| 2013-2014 | NBC | Dracula | Cancelled | 296% | 75 |
| 2013-2014 | ABC | Once Upon a Time in Wonderland | Cancelled | 245% | 96 |
| 2013-2014 | CBS | The Crazy Ones | Cancelled | 194% | 28 |
| 2013-2014 | FOX | Dads | Cancelled | 187% | 80 |
| 2013-2014 | NBC | The Michael J. Fox Show | Cancelled | 122% | 82 |
| 2013-2014 | ABC | Lucky 7 | Cancelled | 112% | 114 |
| 2013-2014 | NBC | Sean Saves the World | Cancelled | 110% | 104 |
The increase in total fans (engagers and non-engagers) definitely has some relationship to viewership. Seven out of the top ten shows with the greatest increase in social fans were ultimately renewed, particularly in the case of Reign. Interestingly enough, this alone did not allow ABC’s Trophy Wife nor The CW’s The Tomorrow People to return for sophomore seasons – neither program did well in the ratings. Perhaps many “liked” the shows’ Facebook pages or followed their Twitter accounts in the beginning, but disappeared before fall was over? Keeping with Affinity Answers’ philosophy, it is much more telling to look at the increase in the percentage of engaged fans.
| Year | Network | Show | Fate | Season Increase – Total Fans | Season Increase – % Engaged Fans | A18-49 Ratings Rank |
| 2013-2014 | NBC | The Blacklist | Renewed | 1,684% | 234% | 7 |
| 2013-2014 | ABC | Once Upon a Time in Wonderland | Cancelled | 245% | 188% | 96 |
| 2013-2014 | NBC | Dracula | Cancelled | 296% | 170% | 75 |
| 2013-2014 | ABC | Super Fun Night | Cancelled | 354% | 169% | 47 |
| 2013-2014 | ABC | Marvel’s Agents of S.H.I.E.L.D. | Renewed | 389% | 152% | 20 |
| 2013-2014 | CBS | Mom | Renewed | 429% | 135% | 40 |
| 2013-2014 | CBS | The Crazy Ones | Cancelled | 194% | 96% | 28 |
| 2013-2014 | ABC | Lucky 7 | Cancelled | 112% | 79% | 114 |
| 2013-2014 | ABC | Betrayal | Cancelled | 720% | 79% | 106 |
| 2013-2014 | CW | The Originals | Renewed | 986% | 77% | 112 |
| 2013-2014 | NBC | Sean Saves the World | Cancelled | 110% | 64% | 104 |
| 2013-2014 | ABC | The Goldbergs | Renewed | 913% | 62% | 51 |
| 2013-2014 | FOX | Dads | Cancelled | 187% | 57% | 80 |
| 2013-2014 | NBC | The Michael J. Fox Show | Cancelled | 122% | 30% | 82 |
| 2013-2014 | FOX | Sleepy Hollow | Renewed | 1,173% | 27% | 15 |
| 2013-2014 | CW | Reign | Renewed | 3,924% | 26% | 149 |
| 2013-2014 | FOX | Brooklyn Nine-Nine | Renewed | 748% | 22% | 56 |
| 2013-2014 | CBS | Hostages | Cancelled | 600% | -2% | 69 |
| 2013-2014 | CW | The Tomorrow People | Cancelled | 2,617% | -4% | 148 |
| 2013-2014 | CBS | The Millers | Renewed | 2,195% | -35% | 23 |
| 2013-2014 | ABC | Back in the Game | Cancelled | 1,803% | -57% | 63 |
| 2013-2014 | ABC | Trophy Wife | Cancelled | 2,848% | -60% | 101 |
This gives us a much clearer picture. For example, NBC’s The Blacklist was an across-the-board success – high increases in social fans, percent of those fans who are engaged and a top 10 rated program. There’s no question why it was renewed for season 2. While this “formula” repeats for shows like ABC’s Marvel’s Agents of S.H.I.E.L.D., the next three programs on the list of top were all cancellations and failed to crack the top 40 in the ratings. Is there another deciding factor in all of this?
It turns out that early momentum is not nearly as impactful as engagement during the season. For example, CBS’ Hostages was one of the most anticipated dramas last fall, but an early pop of engaged fans was not enough to sustain it through what turned out to be a difficult stay in the Monday 10pm slot. The fans migrated away from it on-air and online, and it ultimately met its end. Trophy Wife, again, saw tremendous early buzz on social, but of all the scripted premieres, its engaged fans decreased the most throughout the season.
| Year | Network | Show | Fate | Season Increase – Total Fans | Pre-Season Increase – % Engaged Fans | Season Increase – % Engaged Fans | A18-49 Ratings Rank |
| 2013-2014 | CBS | Hostages | Cancelled | 600% | 860% | -2% | 69 |
| 2013-2014 | ABC | Trophy Wife | Cancelled | 2,848% | 687% | -60% | 101 |
| 2013-2014 | CBS | Mom | Renewed | 429% | 556% | 135% | 40 |
| 2013-2014 | ABC | The Goldbergs | Renewed | 913% | 296% | 62% | 51 |
| 2013-2014 | CBS | The Crazy Ones | Cancelled | 194% | 252% | 96% | 28 |
| 2013-2014 | FOX | Dads | Cancelled | 187% | 218% | 57% | 80 |
| 2013-2014 | ABC | Lucky 7 | Cancelled | 112% | 170% | 79% | 114 |
| 2013-2014 | NBC | The Michael J. Fox Show | Cancelled | 122% | 162% | 30% | 82 |
| 2013-2014 | CBS | The Millers | Renewed | 2,195% | 152% | -35% | 23 |
| 2013-2014 | ABC | Super Fun Night | Cancelled | 354% | 127% | 169% | 47 |
| 2013-2014 | NBC | Sean Saves the World | Cancelled | 110% | 126% | 64% | 104 |
| 2013-2014 | ABC | Back in the Game | Cancelled | 1,803% | 107% | -57% | 63 |
| 2013-2014 | CW | Reign | Renewed | 3,924% | 105% | 26% | 149 |
| 2013-2014 | NBC | The Blacklist | Renewed | 1684% | 102% | 234% | 7 |
| 2013-2014 | CW | The Tomorrow People | Cancelled | 2617% | 101% | -4% | 148 |
| 2013-2014 | ABC | Marvel’s Agents of S.H.I.E.L.D. | Renewed | 389% | 84% | 152% | 20 |
| 2013-2014 | FOX | Brooklyn Nine-Nine | Renewed | 748% | 83% | 22% | 56 |
| 2013-2014 | ABC | Betrayal | Cancelled | 720% | 42% | 79% | 106 |
| 2013-2014 | ABC | Once Upon a Time in Wonderland | Cancelled | 245% | 40% | 188% | 96 |
| 2013-2014 | NBC | Dracula | Cancelled | 296% | 38% | 170% | 75 |
| 2013-2014 | FOX | Sleepy Hollow | Renewed | 1,173% | 30% | 27% | 15 |
| 2013-2014 | CW | The Originals | Renewed | 986% | 11% | 77% | 112 |
So, what does this all mean for this year’s crop of scripted premieres? While it’s been established that success in television is not easily predicted, especially based on one factor, there are some interesting takeaways from the composition of engaged fans and the momentum these shows have built over the last four weeks (through September 3):
| Show | Network | Pre-Season % Engaged Fans | % Change vs. 4 Weeks Ago |
| The Mysteries of Laura | NBC | 46% | -14% |
| Marry Me | NBC | 38% | -9% |
| Bad Judge | NBC | 35% | -10% |
| A to Z | NBC | 34% | -39% |
| State of Affairs | NBC | 25% | 6% |
| Cristela | ABC | 24% | 21% |
| Black-ish | ABC | 21% | -1% |
| Jane the Virgin | CW | 19% | 10% |
| Gracepoint | FOX | 16% | 5% |
| Forever | ABC | 13% | 17% |
| Manhattan Love Story | ABC | 11% | 59% |
| Red Band Society | FOX | 11% | 58% |
| How to Get Away with Murder | ABC | 9% | -12% |
| Mulaney | FOX | 9% | -25% |
| Utopia | FOX | 9% | 40% |
| NCIS: New Orleans | CBS | 8% | 9% |
| iZombie | CW | 8% | 7% |
| The McCarthys | CBS | 5% | 33% |
| Gotham | FOX | 5% | 4% |
| The Flash | CW | 4% | 25% |
| Selfie | ABC | 4% | -23% |
| Scorpion | CBS | 4% | -37% |
| Madam Secretary | CBS | 4% | 113% |
| Allegiance | NBC | 3% | 44% |
| Stalker | CBS | 3% | 58% |
| Constantine | NBC | 1% | -91% |
| The Mysteries of Laura | NBC | 46% | -14% |
The top 5 programs are all from NBC, with The Mysteries of Laura. This show premiered on Wednesday to a strong start. Also notable is FOX’s The Red Band Society, which has also been highly anticipated, but had a soft launch when it also premiered on Wednesday. What is even more interesting are the programs that have gained momentum.
This year’s ranker is much like last year’s in the sense that we have a CBS drama at the top of the list. Madam Secretary, which premiered last night to respectable ratings, has shown the greatest growth in percentage of fans who are engaged, but so did Hostages. Additionally, FOX’s Utopia showed a lot of momentum that has not translated into ratings success so far.
The key takeaway is that while engagement on social media definitely correlates with ratings success, there is no predictive formula. Understanding what your fans will engage with online is a critical factor in building the show’s brand, but conversion from social engagers to regular viewer is a long journey with many roadblocks. Over time, the two groups will overlap more and more from quality content and courting. For now, use social engagement data as a validation for this small, but critical part of the equation.
How will you use affinities data to ensure that your program or brand is a hit, wherever your consumers are?
*Ratings information from Nielsen season-end rankers, as published on Deadline.com (http://deadline.com/2014/05/tv-season-series-rankings-2013-full-list-2-733762/)
Related Posts

Purchase Intent > Past Purchase

Affinity Answers Just Became Un-Skippable
